How to Determine a Researcher’s Impact with Publication Stats

Beyond Citation Counts and h-Index: Evaluating Researcher Value with Scinapse
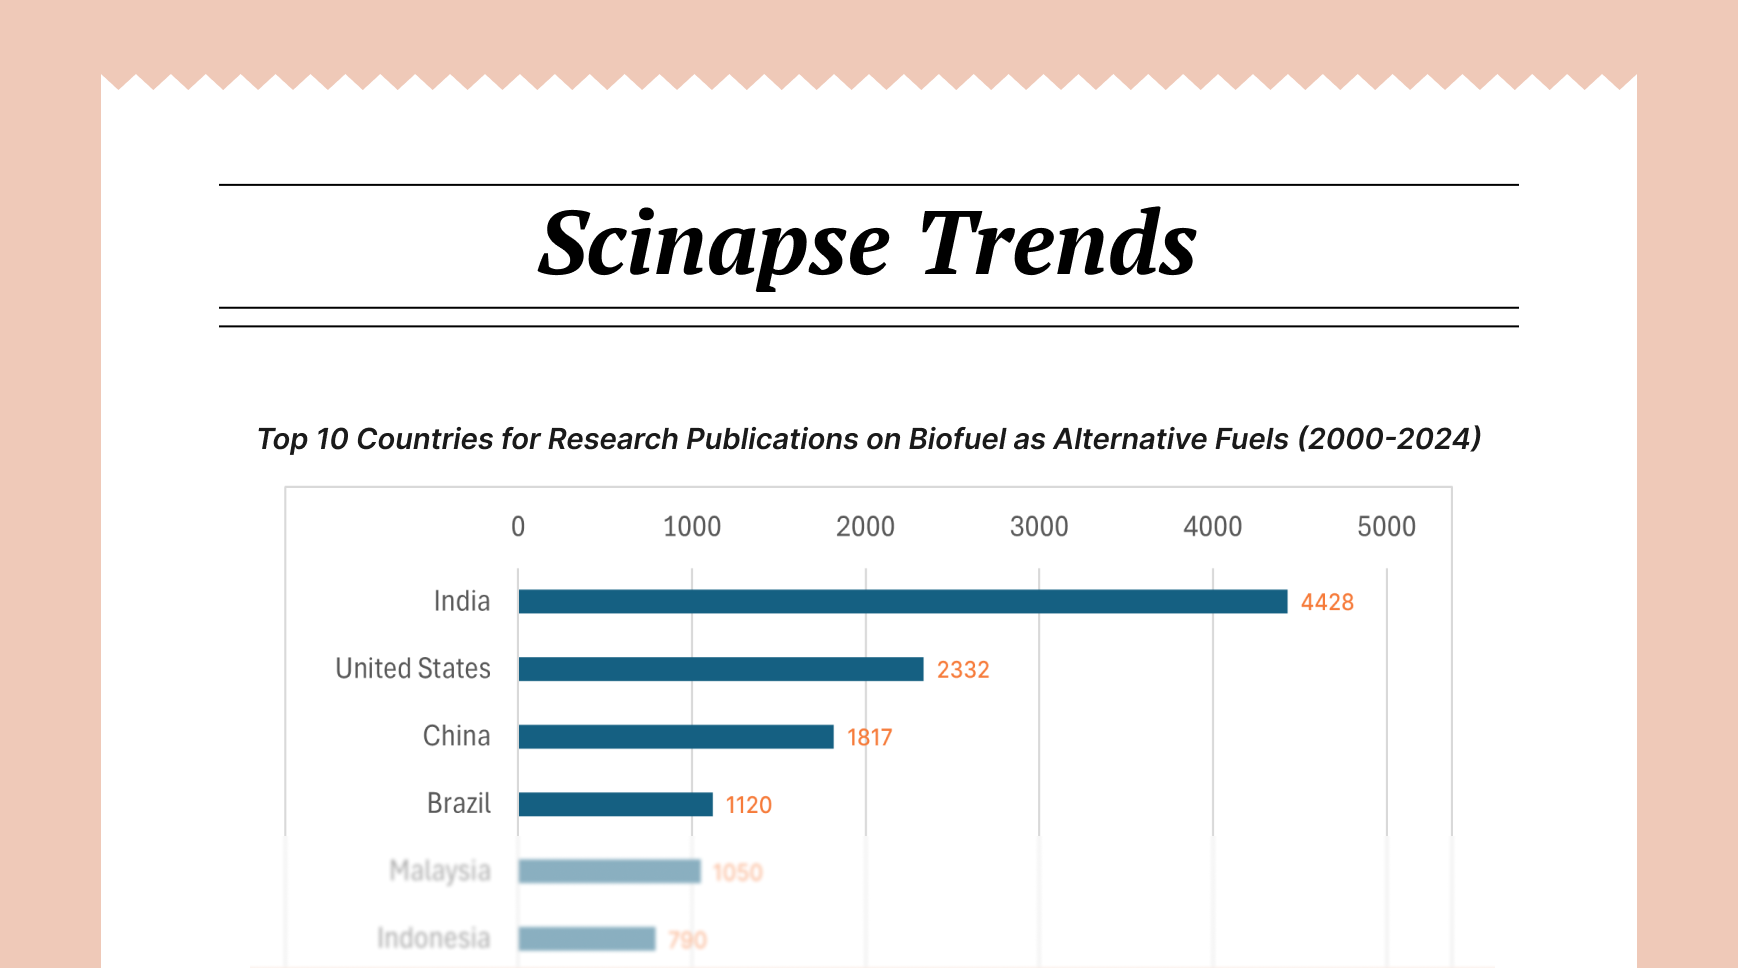
The value and impact of a researcher are often reflected in their publication record. However, not all publication records are created equal. Scinapse, a tool designed to effortlessly reveal both research trends and researcher impact, offers a comprehensive way to analyze publication trends over time, providing valuable insights into a researcher’s sustained contributions and innovations in their field. This tool is especially valuable for entities involved in research and development, as well as academic institutions seeking to hire new talent.

Understanding the Scinapse Graph
The Scinapse graph presents a time-series analysis of a researcher’s publications, providing a clear visual representation of their research output over the years. It’s designed to answer critical questions about a researcher’s current relevance and performance compared to their past:
- Overall Research Output: The graph shows the quantity of research a scholar has recently produced, highlighting their role as the leading contributor. This aspect is crucial for assessing a researcher’s ongoing engagement in their field.
- Participation in Research: By analyzing the proportion of direct participation in research or the ratio of original papers each year, the graph offers insights into the depth of the researcher’s involvement in their field.
- Quality of Contributions:
- Co-authorship Trends: An increasing rate of co-authorship might indicate a shift from leading research to more collaborative roles. This can be a sign of transitioning into mentorship or advisory positions rather than primary research roles.
- Review Paper Ratio: A spike in review papers could suggest a decrease in original research and experimentation, potentially signaling a shift in focus or a decline in innovative output.

Applications in Research and Development
In R&D sectors, the Scinapse graph serves as a vital tool for evaluating the innovativeness and current relevance of potential collaborators or hires. Companies can assess whether a researcher is actively leading new projects or primarily contributing to others’ work. This information is critical when making decisions about whom to involve in cutting-edge research projects, ensuring that the team members are not only well-reputed but also actively contributing to their fields.
Use in Academia
For universities and academic institutions, the Scinapse graph aids in recruitment and evaluation processes. It helps in identifying candidates who are not just resting on past laurels but are actively engaged in producing significant research. Especially for tenure-track positions or roles requiring a strong research background, this tool can distinguish between candidates who are consistently innovative and those whose prime contributions may lie in the past.
The Scinapse graph provides a nuanced understanding of a researcher’s publication trends, going beyond mere numbers. By offering insights into the quality, nature, and trajectory of a researcher’s work, it becomes an indispensable tool for R&D companies and academic institutions alike, ensuring that investments in human capital are well-informed and targeted towards individuals who continue to innovate and lead in their respective fields.
Ready to discover the latest trends in your research area?
👉🏻 Try Scinapse Now
written by Sarah Little
Never re-search again.
Scinapse is made by researchers for researchers.
Join the next generation of research at ⏯️ https://scinapse.io/
Pluto Labs
Pluto Labs helps researchers focus on their research by improving several inefficiencies in the academic research process. We offer data-driven insights from academic papers, allowing users to easily obtain review-level results for their desired range of papers.
https://pluto.im/


Comments ()