
Understanding the Importance of h-Index in Research: A Dive Into Normalized Research Metrics
In academic research, the h-index has emerged as a pivotal indicator of a researcher’s impact and productivity. However, this traditional metric is not without its limitations, particularly when evaluating the burgeoning careers of new researchers. Enter the normalized h-index, a nuanced approach that offers a fairer assessment of a scholar’s contributions.
The Normalized h-Index: A Fairer Measure for Researchers
The normalized h-index, denoted as ℎˉ, is calculated, is calculated by dividing the traditional h-index (ℎ) by the total number of papers authored by the individual (N). This metric provides an insightful proportion (%) of the researcher’s papers that significantly contribute to their academic influence, offering a more equitable view, especially for those in the early stages of their research journey.
For example, consider two researchers: one with an h-index of 30 from 300 papers and another with an h-index of 15 from 25 papers. The traditional h-index would rank the former higher. However, the normalized h-index would reveal that a larger percentage of the latter’s work has had a substantial impact, a detail the traditional h-index overlooks.
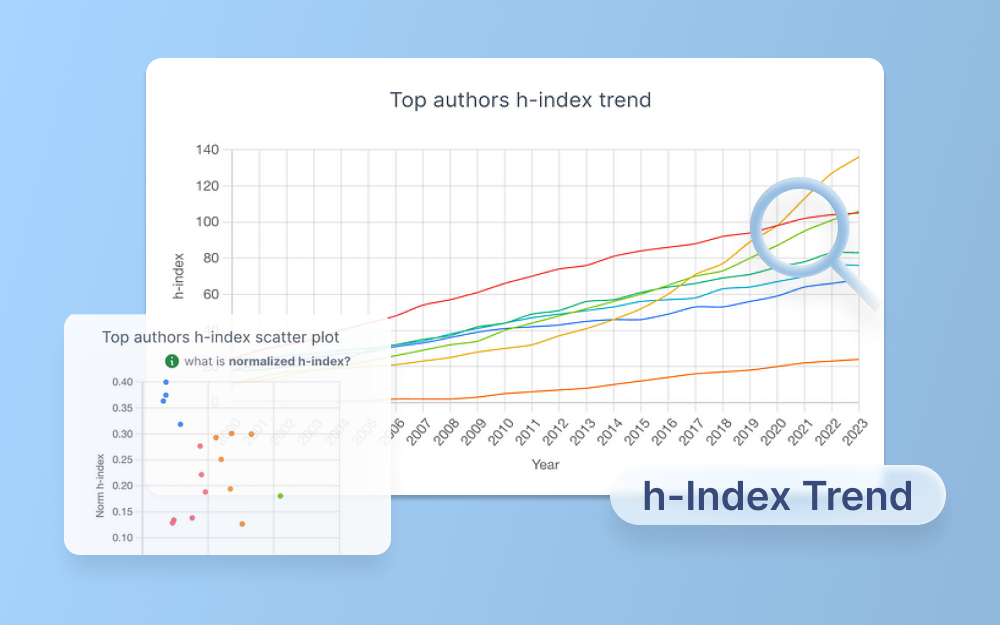
Trending Now: Visualizing the h-Index Over Time
The evolution of a researcher’s h-index over time is a tale of their academic growth and the burgeoning reach of their work. By plotting the annual h-index trend of the top authors, we observe not just a number but a storyline of their scholarly journey. This visualization can help identify not only consistent performers but also rising stars in the academic world whose h-indexes are on a steep upward trajectory.
For example this useful graph from Research Intelligence from Scinapse. After searching my field of interest, the “Authors” tab in Research Explorer and Research Analytics, had this visual representation.
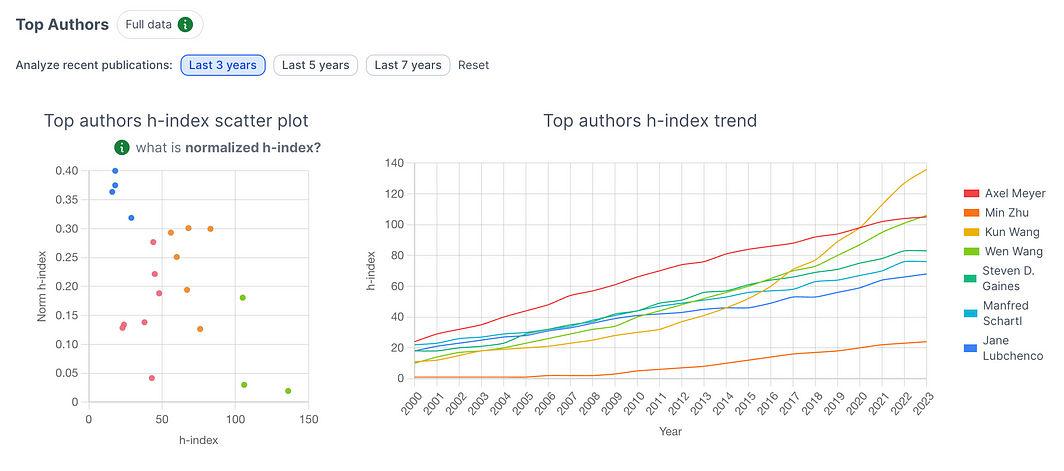
The first graph shows the Normalized h-index of the top 20 authors specifically. The second graph offers a visual representation of the h-index trend of the top 7 authors.
Takeaway
The h-index and its normalized counterpart are more than mere numbers; they are indicators of a scholar’s legacy in the scientific community. While the h-index measures the quantity and influence of a researcher’s work, the normalized h-index brings to light the quality and efficiency of their contributions. Together, these metrics paint a comprehensive picture of an academic’s career, emphasizing that in the world of research, both depth and breadth matter.
written by Sarah Little

Never re-search again.
Scinapse is made by researchers for researchers.
Join the next generation of research at ⏯️ https://scinapse.io/
Pluto Labs
Pluto Labs helps researchers focus on their research by improving several inefficiencies in the academic research process. We offer data-driven insights from academic papers, allowing users to easily obtain review-level results for their desired range of papers.
https://pluto.im/


Comments ()