Advancing Scientific Inquiry Through Data Analysis and Visualization

With advancements in scientific inquiry, data analysis and visualization have become imperative tools for researchers across disciplines. The exponential growth of data generation, coupled with advancements in artificial intelligence (AI) solutions, has revolutionized the way researchers approach complex problems and communicate their findings.
In this article, let’s discuss the pivotal role and utilizing AI for data analysis and visualization to improve your research journey.
Evolution of Scientific Data Analysis and Visualization
Scientific research, a field that was once dominated by manual data collection and analysis has evolved into a data-driven endeavor, where massive datasets are the norm rather than the exception. This shift has been facilitated by technological advancements, allowing researchers to gather, process, and interpret data at unprecedented scales and speeds.
Preprocessing and quality control serve as the foundation, ensuring that raw data is cleaned, normalized, and validated before any meaningful analysis can occur. Statistical techniques, ranging from traditional hypothesis testing to advanced multivariate analyses, form the backbone of quantitative research. Moreover, the integration of machine learning and AI has opened new avenues for pattern recognition and predictive modeling, enabling researchers to uncover insights that were previously beyond reach.
Furthermore, effective visualizations leverage cognitive principles to convey complex information in an accessible manner. From simple scatter plots to elaborate network diagrams, the choice of visualization technique can significantly impact how data is interpreted and understood. Interactive and dynamic visualizations have become particularly valuable for exploring multidimensional datasets, allowing researchers to engage with the data in meaningful ways.
6 Reasons Why Data Analysis and Visualization Is Important
in Scientific Research
- Insight Discovery: Scientific data analysis and visualization enable researchers to uncover hidden patterns, trends, and relationships within complex datasets that might not be apparent through raw data alone, leading to new insights and hypotheses.
- Communication of Complex Information: Visualizations simplify the communication of complex scientific findings to both expert and non-expert audiences. Well-designed visualizations can convey intricate concepts more effectively than text or tables alone.
- Decision Support: Data analysis and visualization provide a solid foundation for evidence-based decision-making in scientific research, policy formulation, and resource allocation.
- Big Data Management: As scientific datasets grow increasingly large and complex, visualization techniques become crucial for making sense of and navigating through vast amounts of information.
- Interdisciplinary Collaboration: Visualizations serve as a common language across different scientific disciplines, fostering collaboration and cross-pollination of ideas among expert researchers from diverse backgrounds.
- Predictive Modeling: It plays a key role in developing and refining predictive models, allowing researchers to forecast future trends and outcomes based on current data.
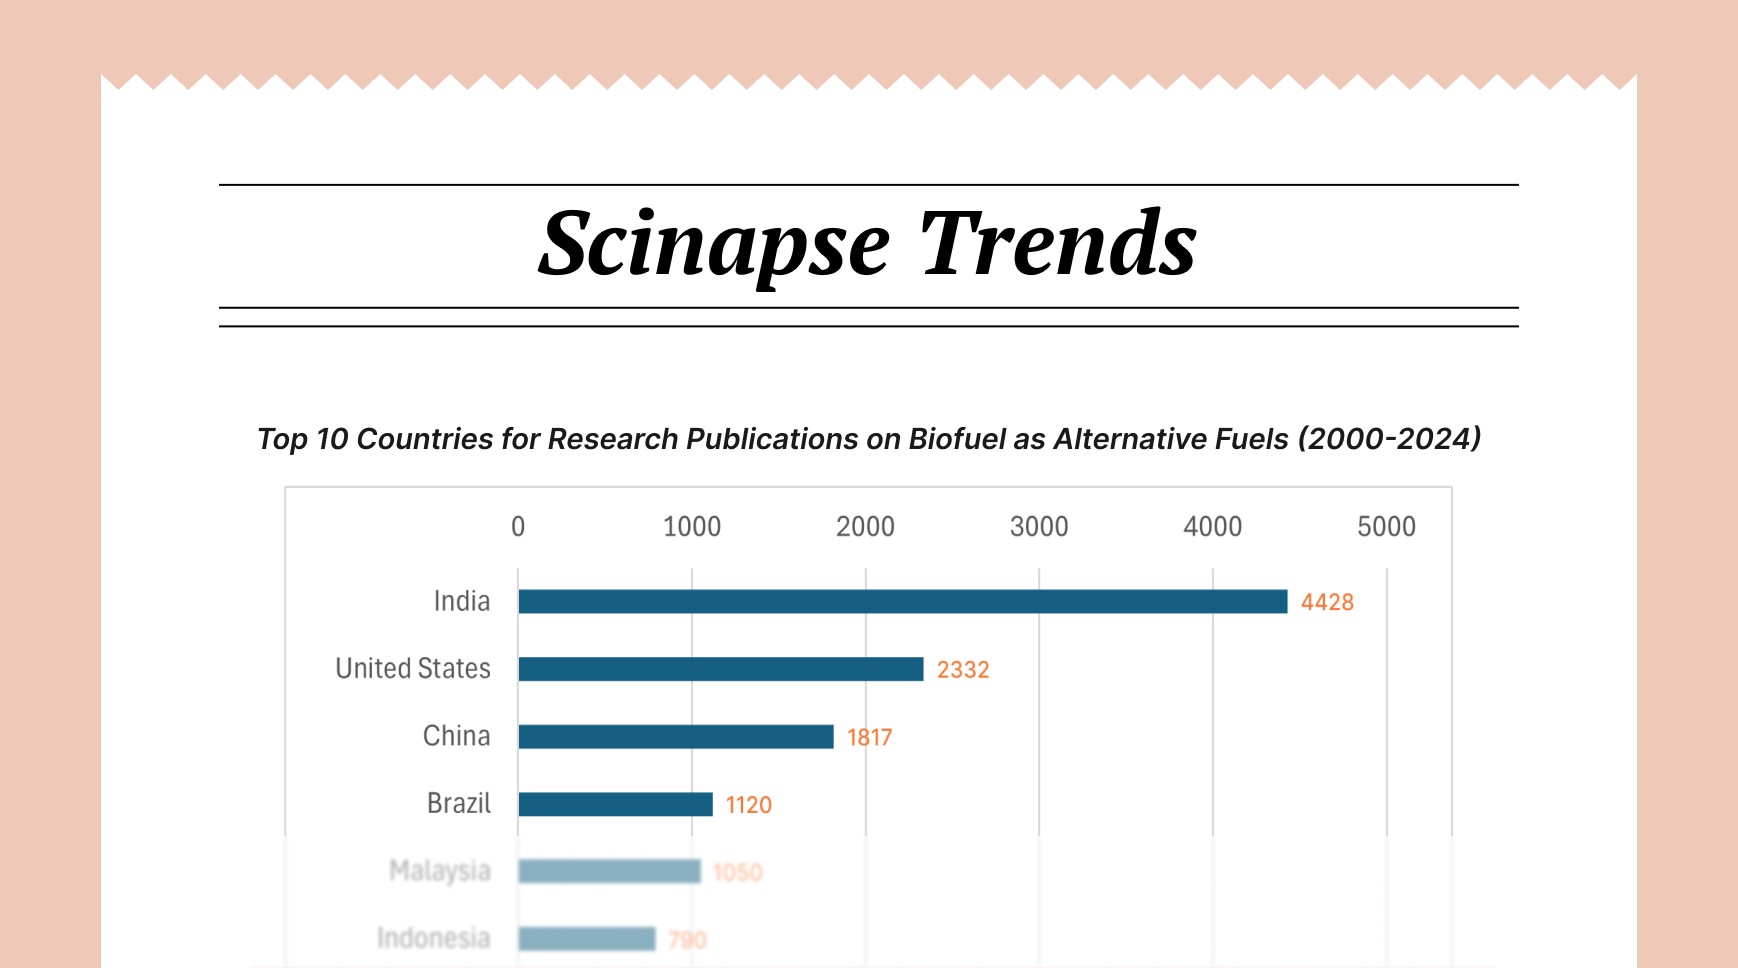
Scinapse: An Emerging AI Tool for Data Analysis and Visualization
As the field continues to evolve, several emerging tools are shaping the future of scientific data analysis and visualization. However, Scinapse is gaining prominence for its ability to enhance research data analysis, offering a comprehensive platform for literature review in its unique form of trend analysis, allowing researchers to efficiently comprehend vast bodies of published literature.
By leveraging advanced algorithms, Scinapse can identify research trends, gaps, and potential collaborations with expert researchers that might otherwise go unnoticed.
Ready to revolutionize your research process? Try Scinapse today and discover what's trending in your field with efficient data analysis and visualizations.
Conclusion: Embracing the Data-Driven Future of Science
As we stand at the edge of these transformative developments, it is clear that data analysis and visualization will continue to play a pivotal role in shaping the future of scientific research. The ability to extract meaningful insights from complex datasets and communicate them effectively is no longer just an asset but a necessity for modern researchers.
written by Uttkarsha B
Never re-search again.
Scinapse is made by researchers for researchers.
Join the next generation of research at ⏯️ https://scinapse.io/
Pluto Labs
Pluto Labs helps researchers focus on their research by improving several inefficiencies in the academic research process. We offer data-driven insights from academic papers, allowing users to easily obtain review-level results for their desired range of papers.
https://pluto.im/

Comments ()